
Scientific forex The Truth Behind Commonly Used Indicators
Página 1 de 1.

Scientific forex The Truth Behind Commonly Used Indicators
Admin Cazadores de Pips Mar Mar 18, 2014 12:13 pm
Scientific forex The Truth Behind Commonly Used Indicators
The Truth Behind Commonly Used Indicators
By Cristina Ciurea
ScientificForex.com
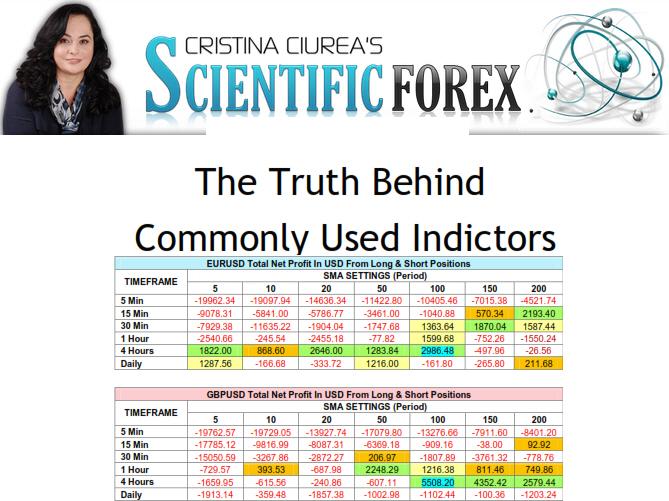
By Author : In order to see if the settings really worked from a scientific point of view, I back-tested the indicators with different settings on a couple of currency pairs and across a variety of timeframes.
To ensure enough trades are entered for reliable results, I ran all back-tests through 4 years of historical data (January 2008 to December 2011). Using similar entry, stop loss and take profit rules for each test, I started out with a $10,000 account and set each trade to be entered at 0.1 lot to allow enough equity for the trades. The spread for EURUSD and GBPUSD is 2 pips.
The rules of the tests are simple.
1. Enter at the close of the candle right after the signal appeared. The signal depends on the indicator or candlestick reversal pattern that is used.
2. Set the stop loss 3 pips above the highest high of the past three candles.
3. Set the take profit twice the value of the stop loss.
The answers to the questions listed in the previous page will be based on some vital data from the results of the backtests. Here’s what we are looking for:
1. Total net profit – Of course, the best measure of performance is the total profit you get from the trades entered. What good is an indicator if it does not help you earn a profit?
2. Percentage of Profit Trades – This indicates the percentage of winning trades from the total number of trades entered. The higher the percentage, the more winners and the better is the performance.
3. Drawdown – It is the difference from highest and lowest balance of the account, in percentage. The lower the drawdown, the more stable are the gains and the better is the performance.
Contents :
INTRODUCTION
METHODOLOGY
MOVING AVERAGES
I. Signal/Entry Trigger
II. Settings
III. Simple Moving Average (SMA) Findings
IV. Exponential Moving Average (EMA) Findings
V. SMA versus EMA
STOCHASTIC OSCILLATOR
I. Signal/Entry Trigger
II. Settings
III. Findings
RELATIVE STRENGHT INDEX (RSI)
I. Entry trigger
II. Settings Tested
III. Findings
CANDLESTICK REVERSAL PATTERNS
I. Dark Cloud Cover
II. Engulfing Pattern
III. Hammer & Hanging Man
IV. Inverted Hammer & Shooting Star
APPLICATION
I. Improving Your Profitability
II. Examples
Bajar:
[Tienes que estar registrado y conectado para ver este vínculo]
The Truth Behind Commonly Used Indicators
By Cristina Ciurea
ScientificForex.com
By Author : In order to see if the settings really worked from a scientific point of view, I back-tested the indicators with different settings on a couple of currency pairs and across a variety of timeframes.
To ensure enough trades are entered for reliable results, I ran all back-tests through 4 years of historical data (January 2008 to December 2011). Using similar entry, stop loss and take profit rules for each test, I started out with a $10,000 account and set each trade to be entered at 0.1 lot to allow enough equity for the trades. The spread for EURUSD and GBPUSD is 2 pips.
The rules of the tests are simple.
1. Enter at the close of the candle right after the signal appeared. The signal depends on the indicator or candlestick reversal pattern that is used.
2. Set the stop loss 3 pips above the highest high of the past three candles.
3. Set the take profit twice the value of the stop loss.
The answers to the questions listed in the previous page will be based on some vital data from the results of the backtests. Here’s what we are looking for:
1. Total net profit – Of course, the best measure of performance is the total profit you get from the trades entered. What good is an indicator if it does not help you earn a profit?
2. Percentage of Profit Trades – This indicates the percentage of winning trades from the total number of trades entered. The higher the percentage, the more winners and the better is the performance.
3. Drawdown – It is the difference from highest and lowest balance of the account, in percentage. The lower the drawdown, the more stable are the gains and the better is the performance.
Contents :
INTRODUCTION
METHODOLOGY
MOVING AVERAGES
I. Signal/Entry Trigger
II. Settings
III. Simple Moving Average (SMA) Findings
IV. Exponential Moving Average (EMA) Findings
V. SMA versus EMA
STOCHASTIC OSCILLATOR
I. Signal/Entry Trigger
II. Settings
III. Findings
RELATIVE STRENGHT INDEX (RSI)
I. Entry trigger
II. Settings Tested
III. Findings
CANDLESTICK REVERSAL PATTERNS
I. Dark Cloud Cover
II. Engulfing Pattern
III. Hammer & Hanging Man
IV. Inverted Hammer & Shooting Star
APPLICATION
I. Improving Your Profitability
II. Examples
Bajar:
[Tienes que estar registrado y conectado para ver este vínculo]

Admin Cazadores de Pips- Cazador Legendario
 Temas : 3755
 Fecha de inscripción : 19/04/2009
 Localización : Sociedad Secreta
-

» Naked Forex- Trading without indicators
» Christina Scientific Forex method
» FREE FOREX INDICATORS
» Logical Forex Indicators
» FOREX-TSD Elite indicators
» Christina Scientific Forex method
» FREE FOREX INDICATORS
» Logical Forex Indicators
» FOREX-TSD Elite indicators
Página 1 de 1.
Permisos de este foro:
No puedes responder a temas en este foro.